그래프 그리기
ax = plt.subplots()
ax = tips['total_bill'].plot.hist()

우선 시리즈에 있는 plot 속성에 정의된 hist 메서드를 사용하여 히스토그램을 그릴 수 있다.
투명도를 조절하려면 hist 메서드의 alpha, bins, ax 인자를 사용하면 된다.
fig, ax = plt.subplots()
ax = tips[['total_bill', 'tip']].plot.hist(alpha=0.5, bins=20, ax=ax)

밀집도, 산점도 그래프, 육각 그래프는 각각 kde, scatter, hexbin 메서드를 사용하면 된다.
fig, ax = plt.subplots()
ax = tips['tip'].plot.kde()

fig, ax = plt.subplots()
ax = tips.plot.scatter(x='total_bill', y='tip', ax=ax)

fig, ax = plt.subplots()
ax = tips.plot.hexbin(x='total_bill', y='tip', gridsize=10, ax=ax)
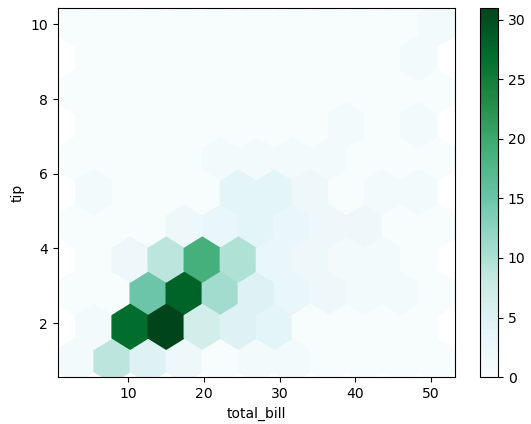
gridsize 인자를 사용하면 육각형 사이즈를 변경할 수 있다.
박스 그래프는 box메서드로 그릴 수 있다.
fig, ax = plt.subplots()
ax = tips.plot.box(ax=ax)

seaborn 라이브러리로 그래프 스타일 설정
set_style 메서드를 사용하여 스타일을 지정하고 설정할 수 있다.
sns.set_style('whitegrid')
fig, ax = plt.subplots()
ax = sns.violinplot(x='time', y='total_bill', hue='sex', data=tips, split=True)

whitegrid 스타일 말고도 ['darkgrid', 'whitegrid', 'dark', 'white', 'ticks'] 같은 스타일이 있다.
데이터 시각화에는 다양한 라이브러리가 있고 계속 업데이트가 진행되고 변경된다.
따라서 공식 문서를 참고하는 것이 좋다.
seaborn: statistical data visualization — seaborn 0.11.1 documentation
Seaborn is a Python data visualization library based on matplotlib. It provides a high-level interface for drawing attractive and informative statistical graphics. For a brief introduction to the ideas behind the library, you can read the introductory note
seaborn.pydata.org
https://matplotlib.org/3.3.3/contents.html
Overview — Matplotlib 3.3.3 documentation
matplotlib.org